


 Consumer Electronics AI
Visibility Index.
2026
How AI engines actually recommend electronics to buyers. Four engines, sixteen categories, 83 brands, 23,973 answers.
Podium 01 · Share of AI Voice
Which electronics brands does AI
talk about most?
Each brand's share of all AI brand-talk per category, averaged equally across the 16 categories.
- 02
 AppleApple9.5%Share of AI VoiceStrongest in Productivity Laptops
Active in 12 of 16 categories - 01
 SamsungSamsung10.4%Share of AI VoiceStrongest in Foldable Smartphones
Active in 10 of 16 categories - 03
 GoogleGoogle8.1%Share of AI VoiceStrongest in Smart Lighting, Climate
Active in 11 of 16 categories
Podium 02 · Recommendation Breadth
Which brands make AI's short list
most often?
How many of the 16 categories each brand lands in AI's top three. Rewards consistent contention across the market, not a few narrow wins.
- 02SamsungSamsung5 / 16Top-3 finishes across the indexTablets · Foldable Smartphones · Budget · Premium · Televisions
across 5 of 16 categories - 01AppleApple6 / 16Top-3 finishes across the indexTablets · Wearable Health · Home Audio · Premium · Productivity Laptops · Smart Lighting, Climate
across 6 of 16 categories - 03GoogleGoogle5 / 16Top-3 finishes across the indexFoldable Smartphones · Budget · Premium · Smart Home Security · Smart Lighting, Climate
across 5 of 16 categories
The corporate view
Which company wins once you
add up all its brands?
The same Share of AI Voice, this time totalled by the company that owns each brand. The single-brand winner and the parent-company winner are not the same.
- 01Samsung10.4%SoV
- 02Apple9.5%SoV
- 03Google8.1%SoV
- 04Nintendo Co., Ltd.
 5.3%SoV
- 05Amazon
 4.8%SoV
- 06ASUSTeK Computer Inc.
 3.8%SoV
- 07Sony
 3.8%SoV
- 08Dell Technologies

 3.7%SoV
The full leaderboard
Who leads AI visibility in my category?
Filter by AI engine, category, and snapshot. Click any brand to see its profile across the index.
AI engine
- All engines
 ChatGPT
 Google AI Mode
 Google AI Overview
 Perplexity
Category
SnapshotMay 2026
Focus brand
View
Engine by engine
Do all the AI engines agree?
They do not. The five engines surface different brands, at different volumes, with different warmth. A brand cannot assume one engine's result holds across the rest.
- ChatGPTThe Cheerleader
- Top-5 visibility
- 23.1%
- Brands / answer
- 3.2
- Positive
- 44.5%
- Negative
- 0.1%
Skews warm: 44.5% of its mentions are positive, with top brands at 23.1% visibility.
Most often ranks #1Samsung · 5 of 16 categories
- Google AI ModeThe Megaphone
- Top-5 visibility
- 30.7%
- Brands / answer
- 3.6
- Positive
- 34.5%
- Negative
- 0.2%
Names the most brands per answer (3.6) of any engine, the widest reach. Its top brands average 30.7% visibility.
Most often ranks #1Samsung · 4 of 16 categories
- Google AI OverviewThe Minimalist
- Top-5 visibility
- 23.9%
- Brands / answer
- 2.8
- Positive
- 38.4%
- Negative
- 0.1%
Names the fewest brands per answer (2.8), the narrowest reach. Top brands average 23.9% visibility.
Most often ranks #1Apple · 3 of 16 categories
- PerplexityThe Critic
- Top-5 visibility
- 26.0%
- Brands / answer
- 3.3
- Positive
- 36.2%
- Negative
- 0.1%
More willing to go negative (0.1% of mentions) and more opinionated than the rest.
Most often ranks #1Samsung · 5 of 16 categories
The citation layer
Which sources is AI actually reading?
Independent editorial publishers dominate. Brands' own websites are a sliver of the AI citation set.
The publishers fueling AI answers across the category.
Top citations across the report.
- Cellmeyourphone1.7%of prompts
- 8bitblood1.3%of prompts
- Bignewsnetwork1.2%of prompts
- Davidreneau1.2%of prompts
- Computermultiverse1.0%of prompts
- Clipstudio1.0%of prompts
- Goodsuite0.9%of prompts
- Cls0.8%of prompts
- Mattpaden0.8%of prompts
- Printguides0.8%of prompts
Percentage = how often the source appears across all prompts in the report. A value above 100% means the source is cited more than once per prompt on average.
The social platforms driving AI's answers.
Social media accounts for 19.7% of all citations in this report. Here is how they split.
- Reddit89.9%of social
- Facebook9.7%of social
- TikTok0.1%of social
- X Corp0.1%of social
- YouTube0.1%of social
- Medium0.1%of social
- Yelp0.0%of social
Percentage = share of all social-media citations going to each platform. Hover any number to see the raw citation count.
The takeaways
So what does this mean for my brand?
What the rankings, engines and citations add up to for anyone deciding where to spend on AI visibility.
- Brand-owned void19.0%of AI's electronics brands citations are brand-owned
Brands' own websites barely move AI. Editorial and social do the talking for them.
- The gatekeepers61.3%comes from third-party editorial
Publishers like Cellmeyourphone, 8bitblood shape what AI says across the category.
- Social signal90%of AI social citations point to Reddit
Reddit is the single largest social source AI draws on in this category.
- Share of voice10.4%of the conversation belongs to Samsung
Samsung leads AI's electronics brands share of voice across 10 of 16 categories.
- Engine spread1.1% vs 0.6%visibility swings sharply by engine
Perplexity surfaces brands most often; ChatGPT least. One AI strategy will not hold across engines.
- The funnel, today0.3%of AI answers are decision-stage, for now
AI is an awareness and consideration channel today. Brands that win it before AI starts closing sales will own the funnel when it does.
From the scoreboard to the win
You can see the scoreboard. Here is how to win it.
This index shows which brands AI recommends today. Winning that answer is a discipline, not luck. See how the biggest brands run AI visibility as a program, with a partner accountable for the outcome.
See how to win in AI visibility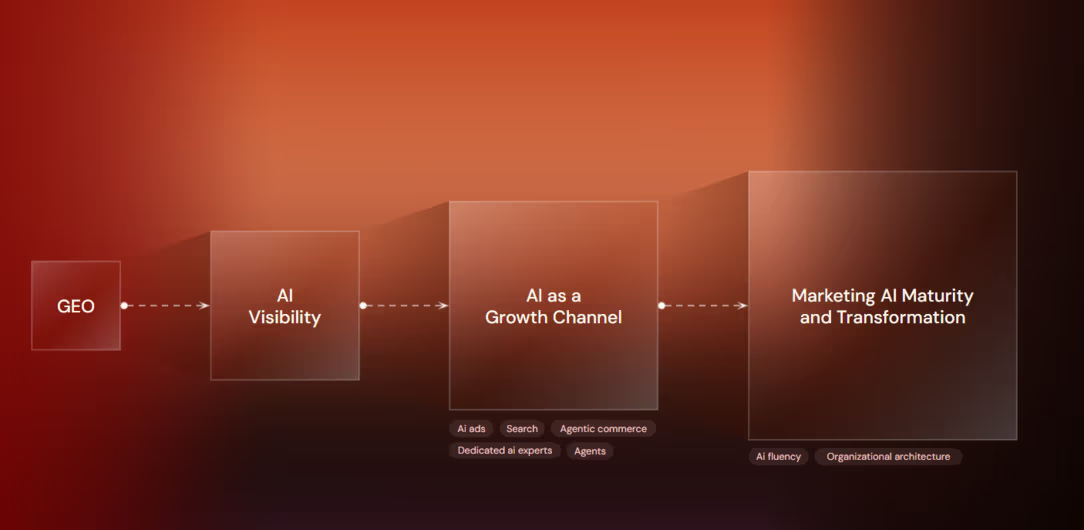
← More research from Brandlight | brandlight.ai

Written by